Ag Weather Data
Weather solutions for every application. Get access to current conditions and forecasts, or more advanced information derived from geospatial imagery.
Basic Weather
Get access to basic weather data to power your app or understand weather conditions in your area. Our simple to use getWeather API can return conditions, forecasts, or even maps.
Advanced Crop Factors
Need something a little more advanced? Our Crop Factors API has deep historical data around geospatially derived measures like NDVI and NDWI. Easily compare areas across time and region.
Growing Conditions
Understand accumulated growing conditions for a given area just by looking at one number from 0-100. Make fast decisions and get unparalleled clarity from your decisions with actionable intelligence.
Explore our Ag Weather APIs
- Ag Related Information - Get up-to-date information on all the Ag weather you need. Data points include soil moisture, evaporation, solar radiation, livestock safety index, growing degree days, heating degree days, and the current drying index. For more advanced Ag weather data, check out our Crop Factors API.
- Current Conditions - Access current weather conditions for your local area or elsewhere. Information includes temperature, atmospheric pressure, heat index / wind chill, wind direction, wind speed, humidity, and dew point.
- Forecasts - Get forecasted weather information by day as requested by zip code. Information includes amount of precipitation, chance of precipitation, windchill, dew / frost weight, and hours of sun.
- Maps - Access map images for many different plot types. Whether you need animated radar or satellite images, we can deliver quality visuals to your app.
- NDVI - Normalized Difference Vegetation Index is a simple graphical indicator that can be used to analyze remote sensing measurements, typically, but not necessarily, from a space platform, and assess whether the target being observed contains live green vegetation or not. In general, if there is much more reflected radiation in near-infrared wavelengths than in visible wavelengths, then the vegetation in that pixel is likely to be dense and may contain some type of forest. Subsequent work has shown that the NDVI is directly related to the photosynthetic capacity and hence energy absorption of plant canopies.
- NDWI - Normalized Difference Water Index is known to be strongly related to the plant water content. It is therefore a very good proxy for plant water stress. Its usefulness for drought monitoring and early warning has been demonstrated in different studies. It is computed using the near infrared (NIR) and the short wave infrared (SWIR) reflectance (Eq.1), which makes it sensitive to changes in liquid water content and in spongy mesophyll of vegetation canopies.
- Land Surface Temperature - Land surface temperature is how hot the “surface” of the Earth would feel to the touch in a particular location. From a satellite’s point of view, the “surface” is whatever it sees when it looks through the atmosphere to the ground. It could be snow and ice, the grass on a lawn, the roof of a building, or the leaves in the canopy of a forest. Thus, land surface temperature is not the same as the air temperature that is included in the daily weather report.
- Air Temperature - Air temperature affects the growth and reproduction of plants and animals, with warmer temperatures promoting biological growth. Air temperature also affects nearly all other weather parameters. For instance, air temperature affects: the rate of evaporation, relative humidity, wind speed and direction, precipitation patterns and types, such as whether it will rain, snow, or sleet.
- Accumulated Precipitation - Rainfall total for the preceding 8 days.
In the Barchart Commodities blog More

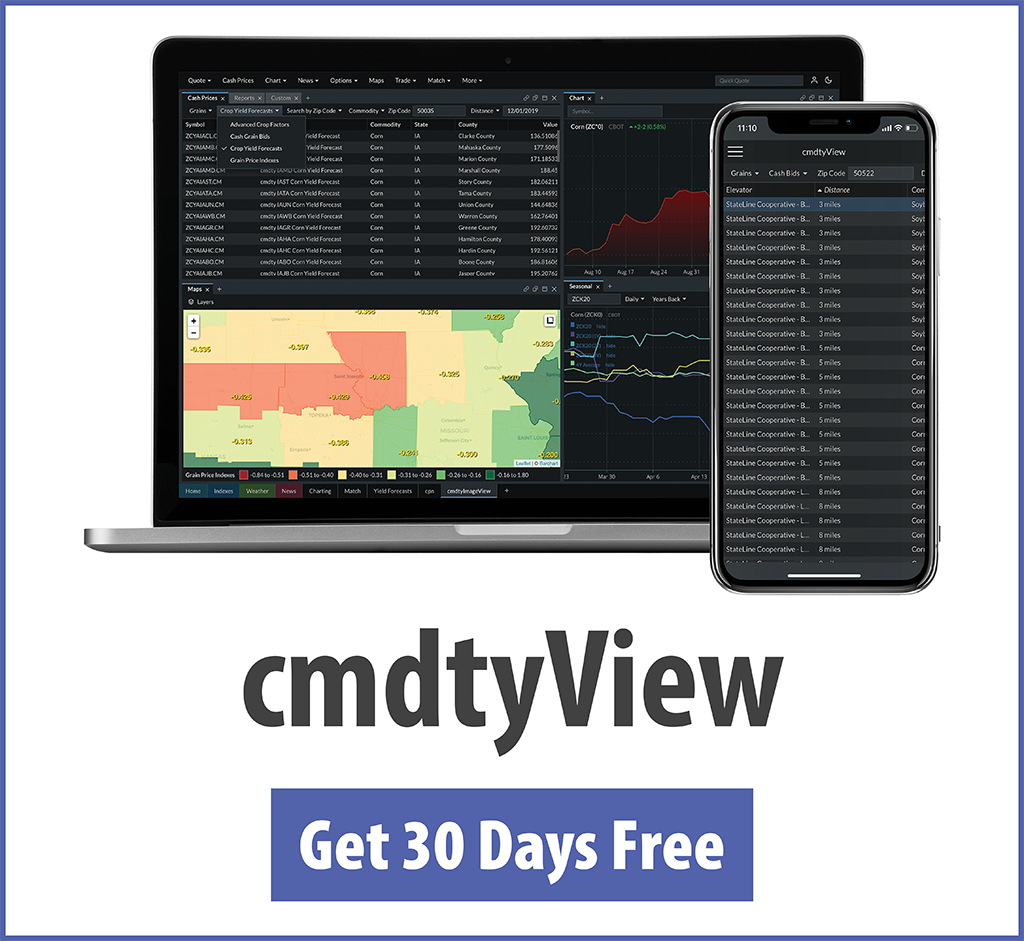

Explore Barchart’s Commodity Pricing Network
Access data from the leading contributors in Ag and Energy. Available over API or through cmdtyView.
Free Commodity Reports
Get access to our proprietary price reports to keep a pulse on global commodity markets.