
Equity Options Price History
Download historical daily options price data for any U.S. or Canadian equity option contract. Historical options data is available for expirations back to January 3, 2017.
Thu, May 25th, 2023
Download Historical Equity Options Data From the Website With Barchart Premier
Barchart Premier Members can download a wide variety of historical options price data direct to a .csv file for use in your favorite spreadsheet. Historical daily price data is available for U.S. and Canadian equity options with expirations back to 01/03/2017. With 100 daily downloads available with your Premier Membership, you have even more flexibility to get the data you want.
- Up to 100 daily downloads, whether individual option contract history, your Screener results, Watchlists, or for other popular Barchart pages.
- Run Advanced Options Screeners to find the best equity options with high theoretical returns.
- Build unlimited Watchlists and Portfolios with email updates to help you track the markets you follow.
- Set your Screeners to automatically run and send you .csv files of the results.
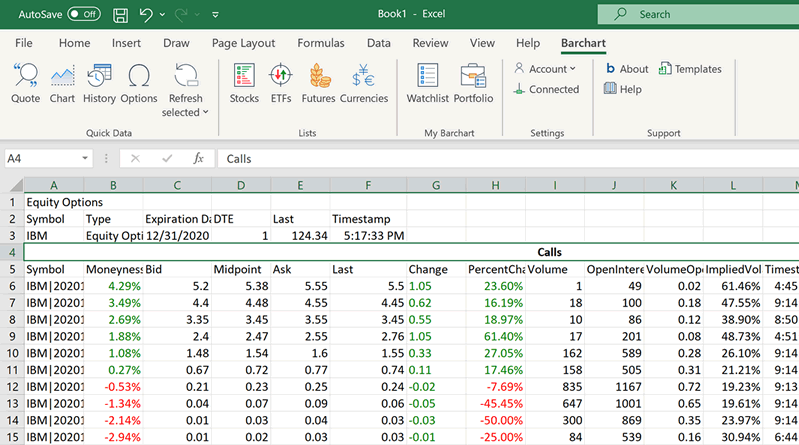
Get More Download Flexibility On Options Data with Barchart for Excel
Barchart for Excel is a powerful tool designed to enrich the data you can find on Barchart.com, but with the added power and flexibility of Microsoft Excel. Blend Barchart data with your own proprietary data, perform calculations, visualize data, and perform sophisticated data analysis directly in Excel!
With Barchart for Excel:
- Automate, save, and store your historical data requests and analysis in Excel, powered by Barchart.
- Perform Excel calculations on Barchart data, including sums, averages, days difference, counts, ranks, or your own custom formulas.
- Use Excel to create custom reports containing key performance indicators on risk and valuation.
- Create data visualizations with Excel charts.
- Store millions of rows of Barchart data.